Trade shows are one of the largest line items in a marketing budget. Exhibit space, shipping, travel, staffing, and promotions add up quickly. The real question every executive asks is: was it worth it?
Answering that question requires more than gut feel. It requires measurement. For years, ROI has been the headline metric. It still matters, but it’s not the whole story. ROY—Return on You—along with a broader set of performance indicators, helps leaders see the full value of their event investments.
Here’s how to approach trade show measurement with clarity and rigor.
ROI: The Standard Metric
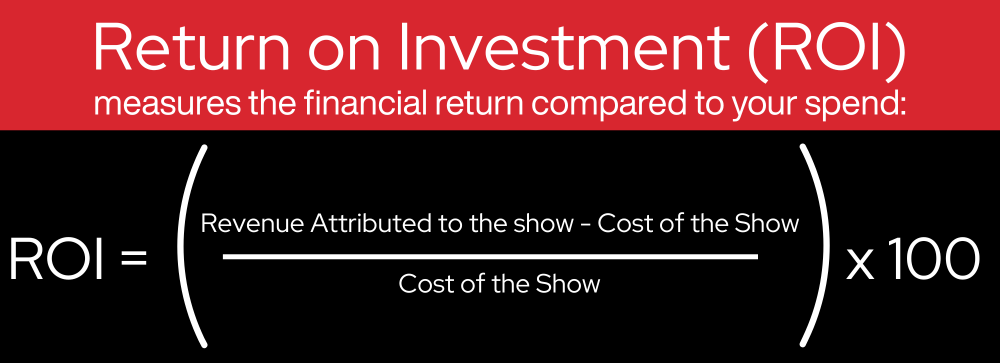
This is straightforward math, but getting the inputs right is where discipline matters.
REVENUE ATTRIBUTION
Tie deals in your CRM back to leads generated or influenced by the show. For many B2B organizations, that means tracking six to twelve months after the event to capture the full sales cycle.
COST ACCURACY
Include everything from booth build, freight, drayage, labor, hotels, meals, and sponsorships to follow-up campaigns. If you underestimate costs, ROI will look inflated.
PIPELINE CONTRIBUTION
Don’t stop at revenue. Measure the size of opportunities created and the average deal value. Sometimes a single large deal offsets dozens of smaller ones.
ROI tells you whether the event paid for itself. It’s the baseline every CFO expects.
ROY: Return on You

Not every return shows up in revenue. Return on You (ROY) captures the personal and organizational value trade shows deliver beyond dollars.
That might include:
- Skills your staff gain from presenting and demoing.
- Stronger collaboration between sales and marketing.
- Industry insights gathered by walking the floor.
- Relationships that set the stage for partnerships.
- Morale and momentum from a team achieving something together.
These are harder to quantify, but they matter. ROY demonstrates that trade shows are not only a financial investment, but also a human one.
Beyond ROI and ROY: Metrics That Matter
Recent industry data highlights other Key Performance Indicators (KPI) that help fill in the picture:
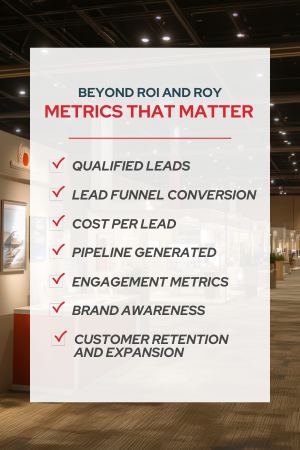
- Qualified Leads: Badge scans mean little without quality. Define what makes a lead sales-ready and measure against that.
- Lead Funnel Conversion: How many leads progress from MQL to sales-accepted to closed-won. This identifies where prospects drop off.
- Cost per Lead: On average, U.S. exhibitors spend $100–$120 per lead. Benchmarking against this helps determine efficiency.
- Pipeline Generated: Track both the number of opportunities and their combined value. Larger deal sizes can shift priorities.
- Engagement Metrics: Booth traffic, dwell time, demos attended, or meetings booked. These are leading indicators of future revenue.
- Brand Awareness: Measure social mentions, share of voice, or survey recall pre- and post-show. Sometimes awareness is the primary goal.
- Customer Retention and Expansion: Many exhibitors use shows to deepen existing relationships. Count meetings with current clients and follow-up business they generate.
Together, these KPIs provide a balanced scorecard of financial performance, engagement, and brand growth.
Building a Measurement Framework
Measurement works best when it is intentional. That means setting up a framework before you step onto the show floor.
- Define success in three categories:
- Financial: pipeline, closed revenue, cost per lead.
- Brand: awareness lift, social engagement, media mentions.
- Team: skills gained, relationships built, collaboration improved.
- Capture all costs:
- Exhibit design and production: include build, graphics, and materials.
- Logistics and travel: track shipping, drayage, hotels, and meals.
- Full spend transparency: account for every expense to ensure accurate ROI reporting.
- Measure before, during, and after the show:
- Before: monitor preshow marketing, appointment setting, and intent data.
- During: track booth traffic, demos, and conversations.
- After: log follow-ups, pipeline progression, and deal conversion.
- Use your CRM and marketing automation tools:
- Maintain disciplined data practices: attribution is only as good as the information you capture.
- Tag and categorize every lead: ensure accuracy and consistency across your database.
- Connect all campaigns: link activities across platforms so results reflect the full customer journey.
- Balance short-term and long-term value:
- Recognize quick wins: some deals will close soon after the show.
- Value strategic opportunities: partnerships and market insights may take longer to develop.
- Measure both timelines: immediate results and future gains each play a role in total ROI.
Measurement Traps
- Attribution blind spots: A long B2B sales cycle rarely has one trigger. Consider multi-touch attribution to capture the show’s influence across the journey.
- Counting every scan as equal: Not all contacts have the same potential. Apply lead scoring to understand true value.
- Ignoring invisible signals: Research shows up to 60% of buyer interest can be “invisible”. Prospects who never stop at your booth but later visit your site or engage digitally. Intent tracking helps uncover this.
- Focusing only on revenue: If you measure only immediate sales, you undercount the impact of awareness, client retention, and strategic learning.
Industry Benchmarks to Keep in Mind
To put numbers in context, here are recent benchmarks that highlight both cost and value:
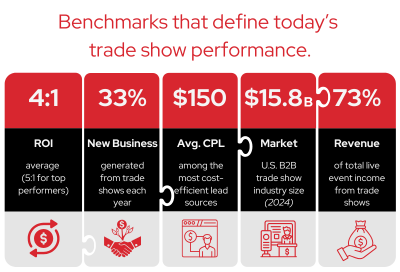
- 4:1 ROI is the average return exhibitors see, with high-performing programs reaching 5:1 or more.
- 33% of new business annually is attributed to trade shows, underscoring their role as a growth driver.
- $100–$120 cost per lead is the benchmark across many verticals, with face-to-face meetings averaging $142 at a show compared to roughly $250 in the field.
- $15.8 billion was the size of the U.S. B2B trade show market in 2024, and it continues to grow.
- 73% of total live event revenue still comes from in-person trade shows, proving their ongoing importance.
These benchmarks aren’t rules, but they give executives a sense of where efficiency and performance should fall and provide a baseline for evaluating the success of their own programs.
Your Bottom Line
Trade shows are complex investments. ROI gives you the financial view. ROY captures the human and strategic value. Layered with other KPIs—leads, engagement, brand lift—you have a reporting framework that speaks to every stakeholder in the business.
When you track rigorously, trade shows shift from being a question mark in the budget to a proven growth driver. They stop being just events and start becoming measurable programs that deliver clarity, connection, and results.
Ready to see more from your next event?